Be confident
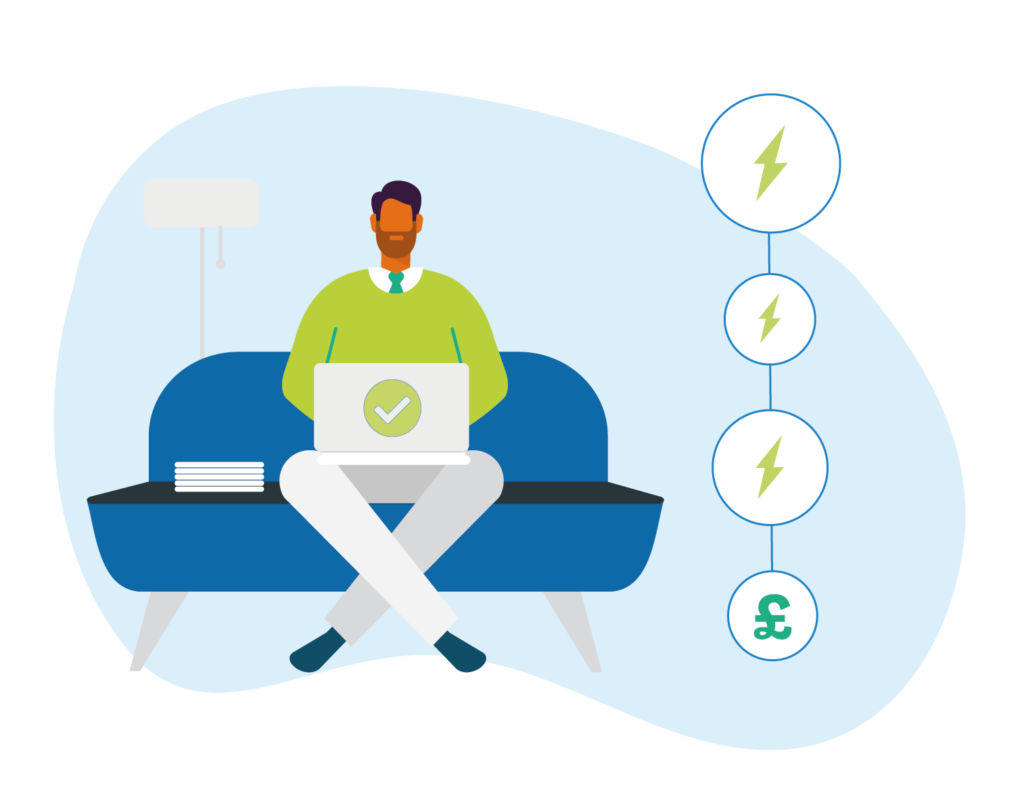
Use AI to create a realistic energy baseline, ensuring full confidence in your forecasting accuracy and reported savings.
Identify opportunities
Set up calculations, predictive analysis, visualisations, and outputs to help you achieve your energy saving goals.
Monitor progress
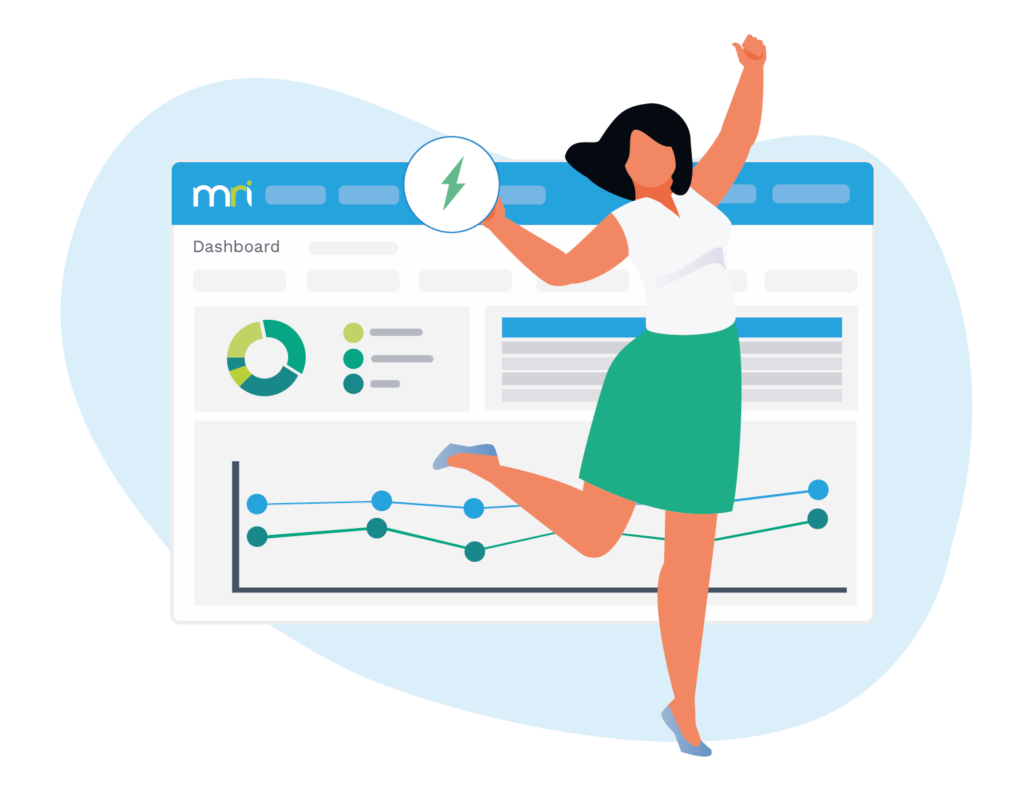
Track performance over time and against a baseline of usage, cost, or carbon. Monitor progress towards your goals.

Is your data making sense?
Many companies struggle to analyse energy data in ways that provide useful and actionable insights. It’s hard to make sense of data when you can’t draw out trends, see anomalies, or use predictive analysis. Most energy consumption analysis runs out of steam with at least one of these problems:
● No way to manage data quality
● Limited or no modelling and forecasting
● Unable to factor weather into data analysis
● Limited options for looking at the data
● Limited choice of graph types
● Too complex to use across the business
● Pretty dashboards lack actionable insights
● No option to save templates
● Non-interactive graphs only
Get the insights you need with customised analysis
Make sense of your data with MRI Energy's sophisticated, targeted, and interactive analyses

AI-driven analysis
MRI Energy offers a huge array of analytics techniques for management of energy that cater across a wide range of sectors. Interactive analyses enable you to drill down, rollup, convert to Co2, cost, and more.

Custom reporting
Access MRI Energy’s report library, use our dynamic reporting tool to easily build your own reports in-system, or have a report custom built by our team for you.

High performance
MRI Energy works with global organizations and big data sets, processing vast amounts of data in milliseconds. You get the insights you need quickly, no matter how much data you are processing.
-
Establish an accurate baseline
-
Identify energy saving opportunities
-
Monitor progress
Establish an accurate baseline

Establish an accurate baseline
The AI-powered Energy Analysis module transforms how you manage energy data. Offering a wide range of dynamic graphs, tables, and customisable reports, it empowers you to present insights tailored for stakeholders at every level. The intuitive interface simplifies complex processes, allowing easy configuration and export of reports. Advanced AI-driven analysis techniques ensure your data is presented in the most insightful, actionable formats, helping optimise efficiency and improve decision-making across sectors.
Identify energy saving opportunities

Identify energy saving opportunities
MRI Energy visualises energy consumption to clearly identify inefficiencies. Graphs such as the surface mapping of a single meter enable you to quickly recognize and react to unusual consumption, while tools such as Baseload Analysis highlight the energy being wasted during out-of-hours periods. Features such as KPI Ranking, which ranks sites and departments by their performance, can determine where action needs to be taken by highlighting the less efficient sites.
Monitor progress

Monitor progress
Verify energy saving opportunities and take action to achieve results. MRI eSight enables you to track progress over time to determine savings made in terms of usage, cost, or carbon. Once a change has been implemented, you can use tools within MRI Energy to monitor your performance against a baseline and prevent deviations or slip-back.
Your energy goals are 3 steps away
1. Book a demo
Tell us the challenges you want to solve and we'll show you how our software works.
2. Analyse your energy usage
Customise your energy analysis to make sense of the data and get actionable insights.
3. Reduce costs
Set your energy goals, monitor performance, and drive down consumption.
Stay updated with the latest energy management news and views
Resources
Let's Connect

Learn how our energy management software can monitor, analyse and reduce energy consumption.
