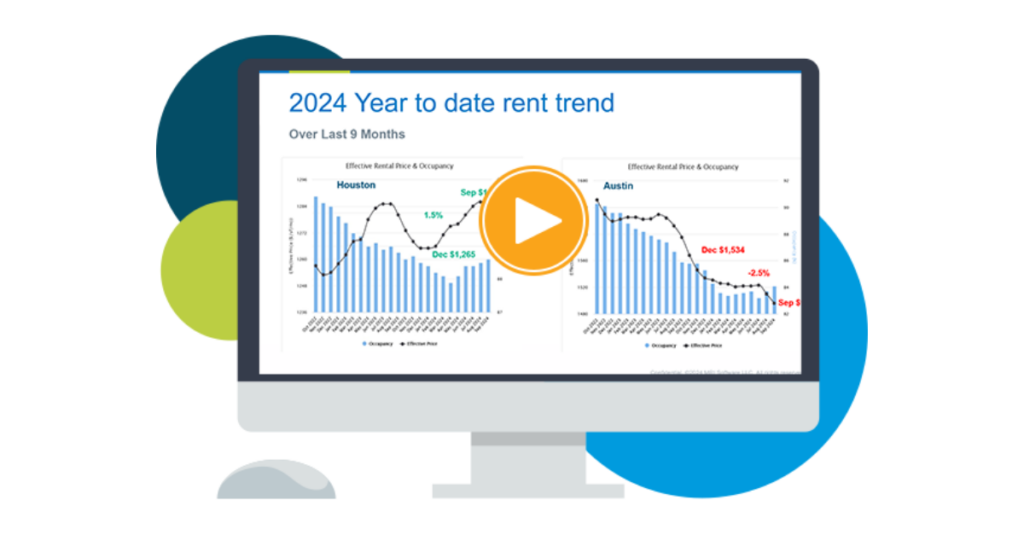
Multifamily rental growth and occupancy update August 2024
This report looks at overall occupancy levels and rental growth trends for 12 markets across Texas, Arizona, Georgia, Tennessee, North Carolina, and Florida.
The first green shoots of market momentum that appeared in June continued to emerge in July. Until June, market commentary had been focused on year-over-year statistics that contain data points from 2023. Adding to the analysis, an examination of how the fundamentals of occupancy, rent, supply, and demand have performed during 2024 currently provides the best guidance for how the year will end.
The issues of too much supply at the top of the market in Class A and a weakness in demand for the stable product Classes of B, C, and D, persist. Because of this, occupancy levels remain challenged. Despite varied occupancy performances in the metro areas we cover, the negativity of rent trends is easing.
Read on for more discussion on how occupancy and rent levels are responding to this seasonally late and mild market strength.
Occupancy
All markets achieved historically high occupancy levels during 2021. From there, occupancy fell relentlessly until the end of 2023, bringing us to the start of 2024 when all markets had overall occupancy levels less than 90% (except for Tampa at 91.0%).
Figure A compares occupancy levels from the beginning of 2024 to occupancy levels at the end of July. The bottom row indicates the change in occupancy for 2024.
Figure A. Occupancy analysis – YTD / July 2024
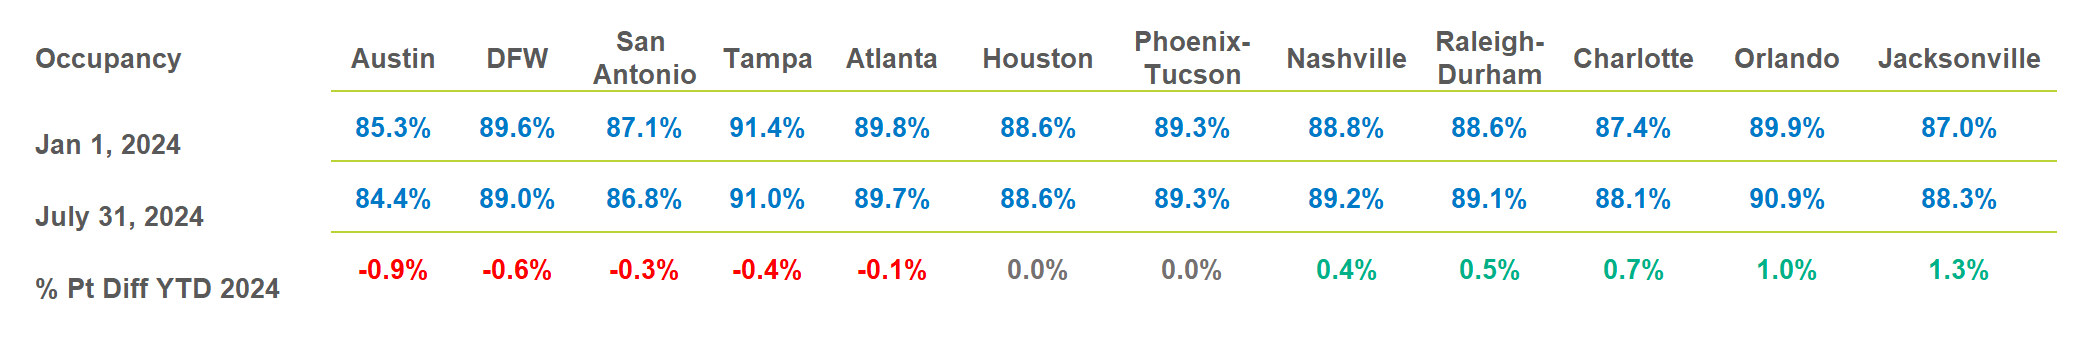
Those markets with negative differences, shown in red, continue to be plagued by new supply outpacing demand or absorption.
Texas markets are leading in the category of over supply with Austin, DFW, and San Antonio claiming the worst occupancy performances in 2024. Phoenix-Tucson and Houston held occupancy flat, teetering on the edge of too much supply.
Those markets with positive occupancy growth, shown in green, were able to move the occupancy needle forward by having absorption win the battle between supply and demand. Jacksonville had the best, most positive occupancy performance of all markets for the first seven months of 2024. However, as the worst-performing market prior to 2024, it was the market with the most to gain.
July marks the end of the traditional “fast leasing season” and Figure A captures what will likely be occupancy highs for the year. As the “slow leasing season” arrives, most markets will continue to deliver hefty amounts of new supply from the under-construction pipeline.
Figure B breaks down the units delivered in 2024 through July, the units presently under construction, and an estimation of the number of units that will be delivered by the end of 2024.
The methodology for determining the number of units delivered by year-end takes the number of units already delivered through July, adding half of the number of units under construction. Also, the estimated number of deliveries for 2024 is compared to a 5-year average of annual deliveries before 2021. This comparison is highlighted in blue and is shown to indicate the weight of new supply in 2024 compared to the long-term average of annual units delivered.
The year-end deliveries in 2024 for most markets are well above their long-term averages, with the exceptions of Atlanta, Orlando, and Jacksonville.
Figure B. New Supply Analysis – July 2024

The bottom line of Figure B, highlighted in light red, represents the new supply that will be delivered throughout the remainder or the second half (2H) of 2024. In all cases, this new supply will move occupancy lower and will be offset by whatever absorption/demand the “slow leasing season” can muster.
The deliveries for the remainder of 2024 in Austin, San Antonio, Tampa, Phoenix-Tucson, Nashville, Raleigh-Durham, and Charlotte either rival or come close to their annual long-term deliveries. This factor raises a caution flag for steeper drops in occupancy and increases pressure to lower rent levels in these markets. DFW is on the watch list with 17,000 more units to be delivered this year.
The bottom line of Figure B also represents the number of units that will be carried forward for delivery in 2025. In summary, half of the units under construction are expected to be delivered in 2024, leaving the other half for 2025 delivery. This number sets the stage for 2025.
All the markets with supply issues in the second half of 2024 will potentially begin 2025 with supply problems that linger well into the new year.
Rent trends
Rental trends have been slowly moderating. Figure C shows the monthly progression in the 12-month rent trends since May which has proven to be the trough for year-over-year (YOY) trends.
Figure C. 12-Month Rent Trends Progression Since May 2024
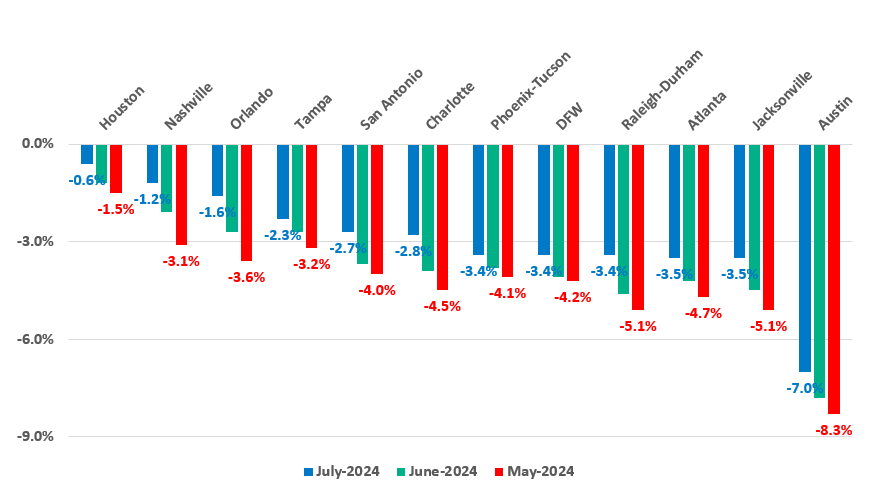
Austin, with a May 12-month trend of -8.3%, has eased to -7.0 percent as of the end of July. The movement for each metro area is uniform from May to July as rent trends move to a less negative position. The sort order for Figure C is based on July’s 12-month trend, listed from best to worst.
The trajectory of sequentially less negative trends shown in Figure C has begun to make a difference in shorter-term trends. Figure D compares the 6-month annualized trend to the 12-month trend as of the end of July. The metro markets are arranged by the market with the worst six-month rent trend to the best.
Austin has the worst trend at a negative 2.1% and Nashville has the best at a positive 4.0%. The 12-month rent trend has been depressing to follow, but the six-month trend looks dramatically better.
Figure D. 6-Month and 12-Month Rent Trends – July 2024

There are some data series and calculation methods to consider when comparing these measures.
The 12-month trend has six months’ worth of data points from 2023 as part of its calculation which is the main reason for its hyper-negativity. The six-month trend only has data points from 2024, but the trends are annualized. This means that the actual trend value for the first six months of 2024 is multiplied by two to arrive at the annualized trend.
This treatment assumes that the same trend that occurred over the first six months will continue for the next six months. While this is unlikely, focusing on this trend at the end of July provides a basis to determine which markets have turned positive, listed in green, and which remain less negative, shown in red.
There are two reasons why the six-month trend values are unlikely to continue and will move lower by year-end. One is the approaching “slow leasing season” beginning in September and continuing through January, when absorption or demand is noticeably reduced. The second reason for faltering rent trends is the substantial number of units that will be delivered as indicated in Figure B.
The combination of less demand and more supply is a recipe for weaker market conditions.
Prospects for 2024
The bad news is that conditions will weaken as 2024 ends. The good news is that 10 of the 12 markets shown in Figure D have realized positive rent growth through July.
Nashville, Orlando, Houston, Charlotte, Jacksonville, San Antonio, and Raleigh-Durham have the best chances of realizing positive rent growth this year in the 1% to 2% range. Tampa, Phoenix-Tucson, Atlanta, and DFW look to attain flat rent growth this year based on their six-month position. The prospects are dim for attaining positive rent growth in Austin this year.
Budget time for 2025
Budget season is upon us once again, and financial and economic conditions are in turmoil. U.S. job growth for July was well below the expectation of 185,000. In addition, unemployment rose from 4.1% to 4.3%. Lower job growth and higher unemployment do not support a strong demand narrative for 2025.
It’s fortunate that a slowing job growth scenario will be met with a decreased pipeline of supply in 2025. However, several markets will still be working through the current supply bubble during the first half of 2025, such as Austin, San Antonio, Tampa, Phoenix-Tucson, Nashville, Raleigh-Durham, DFW, and Charlotte.
Close attention should be paid to the submarkets that still have new supply coming and lease-ups in progress. These submarkets will be challenged for rent growth and should budget accordingly.
Submarkets with little –to no new supply should look to the past or to 2024 submarket and/or class performance for guidance. In 2024, many submarkets or classes of properties within a submarket were decent growth performers. Yet, those performances were overshadowed by the oversupply issues at the top of the market.
Expect overall rent growth for 2025 to be in the range of 2% to 4% with a wide range of winners and losers.
Stay tuned as we continue this series with updated reporting on market conditions throughout the remainder of 2024.
Interested in learning more? The MRI ApartmentData multifamily market intelligence platform can assist with budget preparations and provide key statistics by submarket and class to simplify your budgeting process. Contact us for a consultation today.
View additional detail on rental rate, occupancy, and absorption trends in our monthly Market Line Reports.
Multifamily market transitions: the changing dynamics of supply, demand, and financing
The multifamily market activity we’ve witnessed since the end of the global pandemic has become a familiar pattern of instability, characterized by extreme shifts in rental growth, supply levels, and absorption rates. Several factors, including the m…